mydata <- matrix(1:9, ncol = 3,nrow = 6) #生成一个3列、6行的矩阵数据
mydata[3,3] <- NA #生成一个缺失值
mydata <- as.data.frame(mydata) #如果要生成新的一列需要转换为数据框形式
mydata
V1 V2 V3
1 1 7 4
2 2 8 5
3 3 9 NA
4 4 1 7
5 5 2 8
6 6 3 9参考:
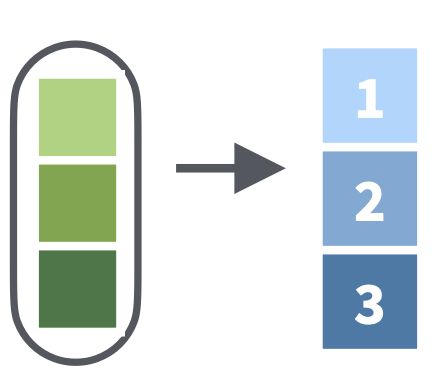
循环迭代,就是将一个函数依次应用(映射)到序列的每一个元素上。用R写循环从低到高有三种境界:基础的显式for循环,到apply()函数家族,最后到purrr包map()函数家族泛函式编程。在R语言中应该尽量避免显式循环的应用。而apply()函数家族和map()函数家族都能够用于避免显式使用循环结构。map()系列函数提供了更多的一致性、规范性和便利性,更容易记住和使用。速度来说,apply()家族稍快,但可以忽略不计。
apply函数家族lapply()包含在R的基础包内,返回一个长度与 X(输入)相同的列表,其中的每个元素都是将目标函数(FUN)应用于X的相应元素的结果。其基本语法和map()一致,所以参考下面的map()函数的介绍。与之类似的apply()函数适合对数据框的操作,能够将目标函数应用于输入数据的行或列,然后输出一个向量或列表。
生成案例数据
mydata <- matrix(1:9, ncol = 3,nrow = 6) #生成一个3列、6行的矩阵数据
mydata[3,3] <- NA #生成一个缺失值
mydata <- as.data.frame(mydata) #如果要生成新的一列需要转换为数据框形式
mydata V1 V2 V3
1 1 7 4
2 2 8 5
3 3 9 NA
4 4 1 7
5 5 2 8
6 6 3 9计算mydata数据集中每一行的均值并添加到每一行后面
mydata$Row_Means <- apply(
  mydata,
  MARGIN = 1, # 1:对每行进行运算;2:对列进行运算;MARGIN=c(1,2)对行、列运算
  mean, # 要应用的函数
  na.rm = T # 是否忽略缺失值
)
mydata
V1 V2 V3 Row_Means
1 1 7 4 4
2 2 8 5 5
3 3 9 NA 6
4 4 1 7 4
5 5 2 8 5
6 6 3 9 6求mydata数据集每一行第一列和第二列的均值
  V1 V2 V3 Row_Means Row_Means12
1  1  7  4         4         4.0
2  2  8  5         5         5.0
3  3  9 NA         6         6.0
4  4  1  7         4         2.5
5  5  2  8         5         3.5
6  6  3  9         6         4.5
对mydata的每一列进行求和运算
  V1 V2 V3 Row_Means Row_Means12
1  1  7  4         4         4.0
2  2  8  5         5         5.0
3  3  9 NA         6         6.0
4  4  1  7         4         2.5
5  5  2  8         5         3.5
6  6  3  9         6         4.5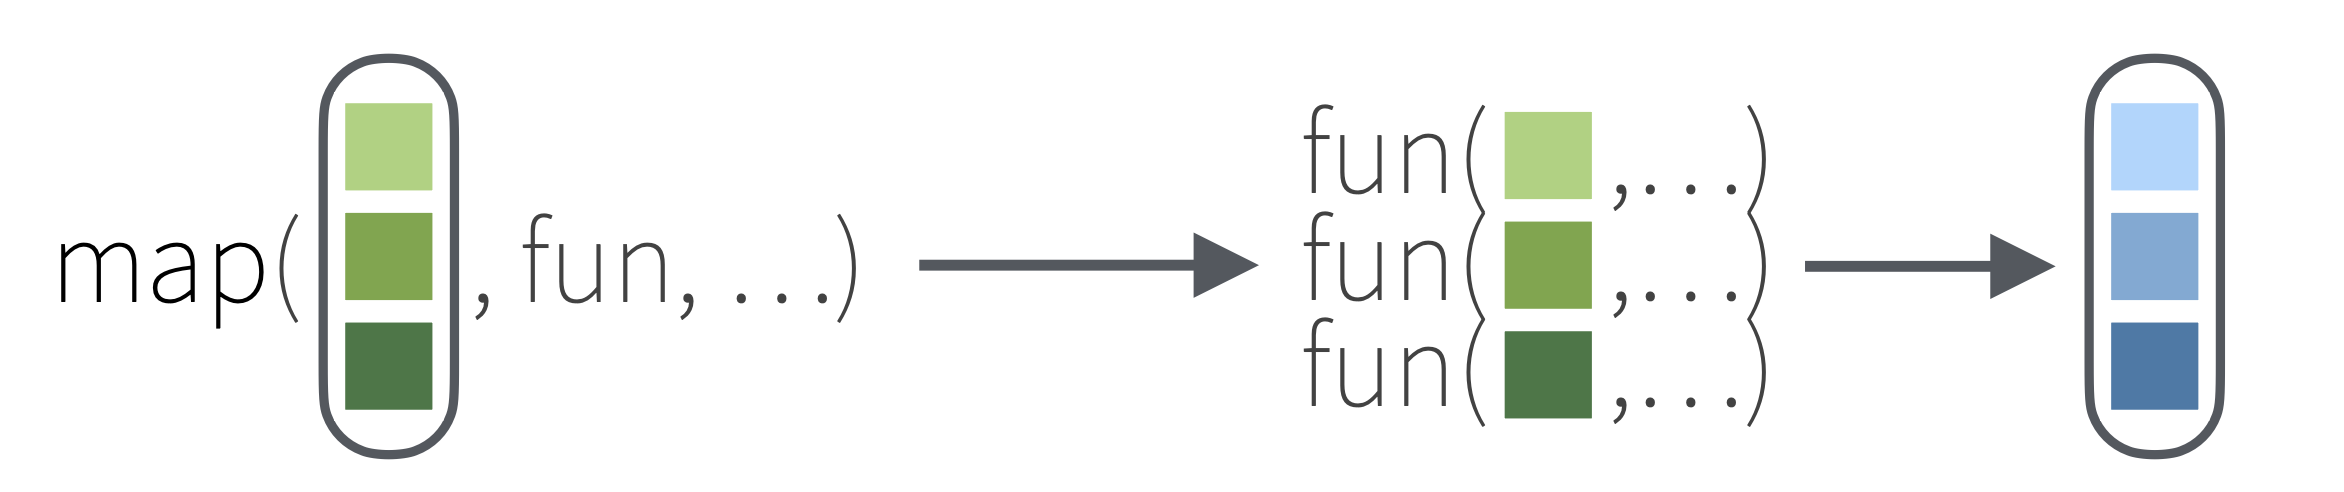
7 21 30 33 30 25.5purrr包map()函数家族map()
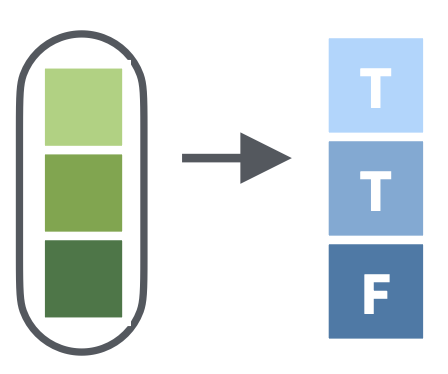
依次应用一元函数到一个序列的每个元素上,基本等同 lapply():
序列包括以下的类型:
原子向量(各个元素都是同类型的),包括 6 种类型:logical、integer、double、character、complex、raw,其中 integer 和 double 也统称为numeric
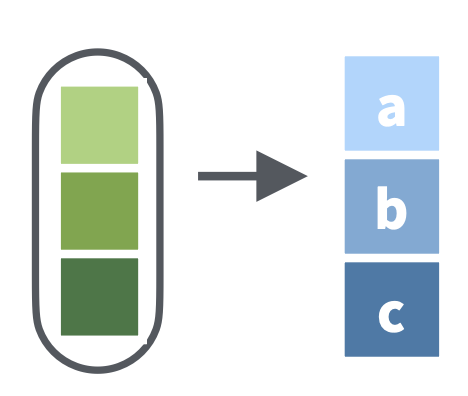
列表(包含的元素可以是不同类型的)
$x
[1] "a" "b"

$y
[1] "c" "d"
# 让chr中的字符降序排列
map(chr, sort, decreasing = TRUE)$x
[1] "b" "a"
$y
[1] "d" "c"如过map()应用对象是数据框,那么会将函数应用于数据框的每一列(可以把数据框的每一列看作一个元素):
x_df <- data.frame(a = 1:10, b = 11:20, c = 21:30)
x_df
a b c
1 1 11 21
2 2 12 22
3 3 13 23
4 4 14 24
5 5 15 25
6 6 16 26
7 7 17 27
8 8 18 28
9 9 19 29
10 10 20 30# 计算x_tab每一列的均值
map(x_df, mean)$a
[1] 5.5
$b
[1] 15.5
$c
[1] 25.5mean()函数还有其它参数,如 na.rm,这些需要特别指定的目标函数参数可以放到函数的后面:
map(x_df, mean, na.rm = TRUE) # 因为数据不含NA, 故结果同上$a
[1] 5.5
$b
[1] 15.5
$c
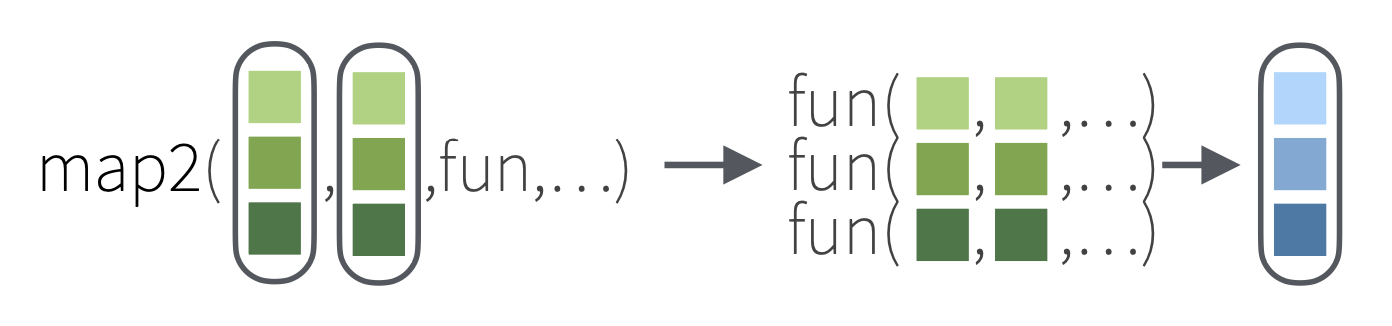
[1] 25.5map2()
依次应用二元函数到两个序列的每对元素上(要求两个序列有相同的长度):
x <- list(a = 1:10, b = 11:20, c = 21:30)
x
$a
[1] 1 2 3 4 5 6 7 8 9 10
$b
[1] 11 12 13 14 15 16 17 18 19 20
$c
[1] 21 22 23 24 25 26 27 28 29 30y <- list(1, 2, 3)
y[[1]]
[1] 1
[[2]]
[1] 2
[[3]]
[1] 3map2(x, y,\(x, y) x*y)$a
[1] 1 2 3 4 5 6 7 8 9 10
$b
[1] 22 24 26 28 30 32 34 36 38 40
$c
[1] 63 66 69 72 75 78 81 84 87 90map2()应用对象也可以是数据框和向量:
y_vec <- c(1:3)
y_vec
[1] 1 2 3# 将y_vec中的每一个元素逐一与x_df中对应的列中的每个值相乘
map2(x_df, y_vec, \(x, y) x*y)$a
[1] 1 2 3 4 5 6 7 8 9 10
$b
[1] 22 24 26 28 30 32 34 36 38 40
$c
[1] 63 66 69 72 75 78 81 84 87 90y_df <- data.frame(d = 21:30, e = 11:20, f = 1:10)
y_df d e f
1 21 11 1
2 22 12 2
3 23 13 3
4 24 14 4
5 25 15 5
6 26 16 6
7 27 17 7
8 28 18 8
9 29 19 9
10 30 20 10# 将y_df中的每列逐一与x_df中对应的列中的每个值相乘
map2(x_df, y_df, \(x, y) x*y)$a
[1] 21 44 69 96 125 156 189 224 261 300
$b
[1] 121 144 169 196 225 256 289 324 361 400
$c
[1] 21 44 69 96 125 156 189 224 261 300# 输出数据框
map2_df(x_df, y_df, \(x, y) x*y)# A tibble: 10 × 3
a b c
<int> <int> <int>
1 21 121 21
2 44 144 44
3 69 169 69
4 96 196 96
5 125 225 125
6 156 256 156
7 189 289 189
8 224 324 224
9 261 361 261
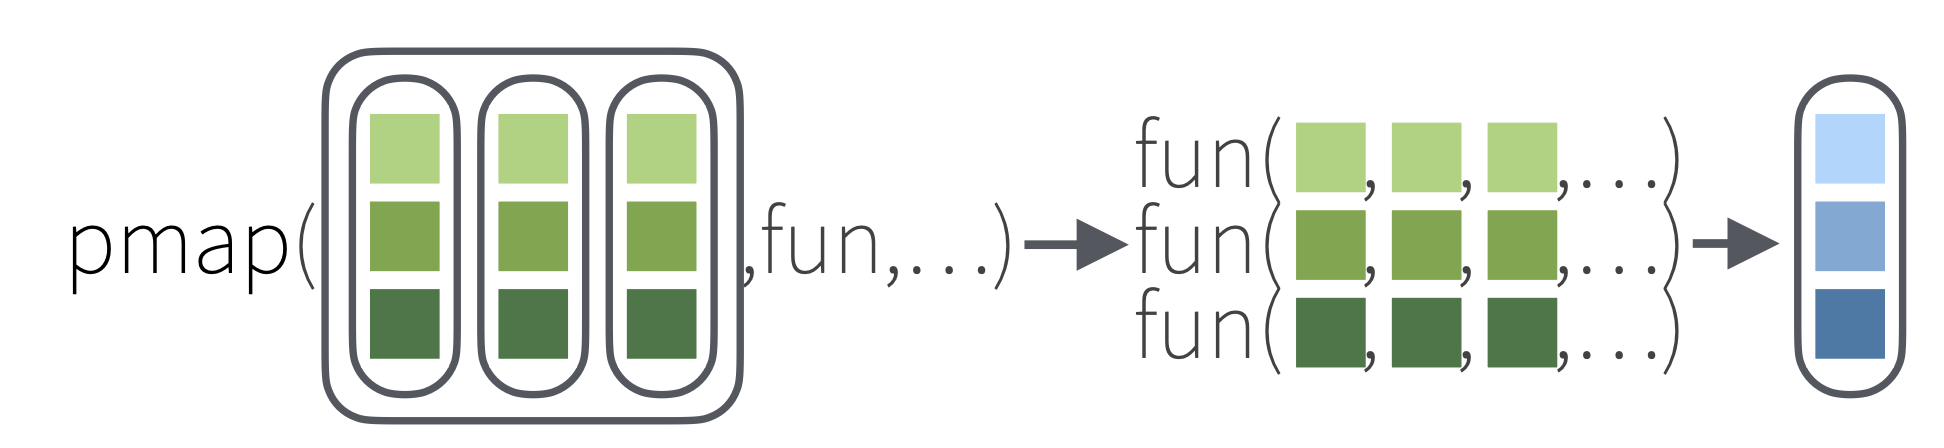
10 300 400 300pmap()
应用多元函数到多个序列的每组元素上,可以实现对数据框逐行迭代
$a
 [1]  5 10 15 20 25 30 35 40 45 50

$b
 [1]  77  84  91  98 105 112 119 126 133 140

$c
 [1] 189 198 207 216 225 234 243 252 261 270
也可以应用于数据框,实现对数据框逐行迭代:
x_df a b c
1 1 11 21
2 2 12 22
3 3 13 23
4 4 14 24
5 5 15 25
6 6 16 26
7 7 17 27
8 8 18 28
9 9 19 29
10 10 20 30pmap_dbl(
x_df,
~ ..1 * (..2 + ..3)
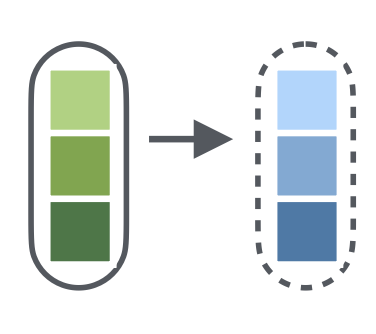
) # 这里用带后缀的形式(pmap_dbl)返回数值型向量(见下文) [1] 32 68 108 152 200 252 308 368 432 500map函数添加后缀map系列函数的运算结果默认是列表型的,但是map系列函数都有后缀形式,以决定循环迭代之后返回的数据类型,这是 purrr 比 apply函数族更先进和便利的一大优势。常用后缀如下(这里以map()为例,map2()和pmap()也有与之对应的后缀):
map_dbl(.x, .f): 返回数值型向量
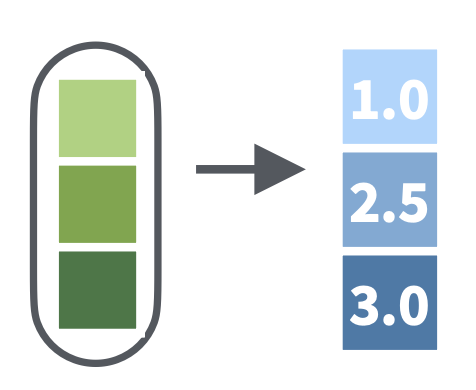
【案例】在上面的map()案例中,求均值返回的结果是数值型,所以更好的做法是将返回结果指定为数值型向量,只需在map后加上_dbl的后缀:
map_dbl(x_df, mean) a b c
5.5 15.5 25.5 map_int(.x, .f): 返回整数型向量
map_lgl(.x, .f): 返回逻辑型向量
map_chr(.x, .f): 返回字符型向量
map_dfr(.x, .f): 返回数据框列表,再 bind_rows 按行合并为一个数据框
【案例】批量读取具有相同列名的数据文件并合并成一个数据框
files = list.files("datas/", pattern = "xlsx", full.names = TRUE)
df = map_dfr(files, read_xlsx)    # 批量读取+按行堆叠合并
map_dfr(files, read_xlsx) 依次将 read_xlsx() 函数应用到各个文件路径上,即依次读取数据,返回结果是数据框,同时“dfr”表示再做按行合并,一步到位。若需要设置 read_xlsx() 的其它参数,只需在后面设置即可。
map_dfc(.x, .f): 返回数据框列表,再 bind_cols 按列合并为一个数据框
walk()系列
将函数依次作用到序列上,不返回结果。有些批量操作是没有或不关心返回结果的,例如批量保存到文件:save(), write_csv() 、saveRDS()等。walk()系列同样包括了walk()、walk2和pwalk()。
【例一】将mpg数据按“manufacturer”分组,每个“manufacturer”的数据分别保存为单独数据文件。
# A tibble: 6 × 11
  manufacturer model displ  year   cyl trans      drv     cty   hwy fl    class
  <chr>        <chr> <dbl> <int> <int> <chr>      <chr> <int> <int> <chr> <chr>
1 audi         a4      1.8  1999     4 auto(l5)   f        18    29 p     compa…
2 audi         a4      1.8  1999     4 manual(m5) f        21    29 p     compa…
3 audi         a4      2    2008     4 manual(m6) f        20    31 p     compa…
4 audi         a4      2    2008     4 auto(av)   f        21    30 p     compa…
5 audi         a4      2.8  1999     6 auto(l5)   f        16    26 p     compa…
6 audi         a4      2.8  1999     6 manual(m5) f        18    26 p     compa…
# 通过group_nest将mpg数据按“manufacturer”分组,每个“manufacturer”的数据分别保存为单独数据
library(dplyr)
df <- group_nest(df, manufacturer)
df# A tibble: 15 × 2
manufacturer data
<chr> <list<tibble[,10]>>
1 audi [18 × 10]
2 chevrolet [19 × 10]
3 dodge [37 × 10]
4 ford [25 × 10]
5 honda [9 × 10]
6 hyundai [14 × 10]
7 jeep [8 × 10]
8 land rover [4 × 10]
9 lincoln [3 × 10]
10 mercury [4 × 10]
11 nissan [13 × 10]
12 pontiac [5 × 10]
13 subaru [14 × 10]
14 toyota [34 × 10]
15 volkswagen [27 × 10]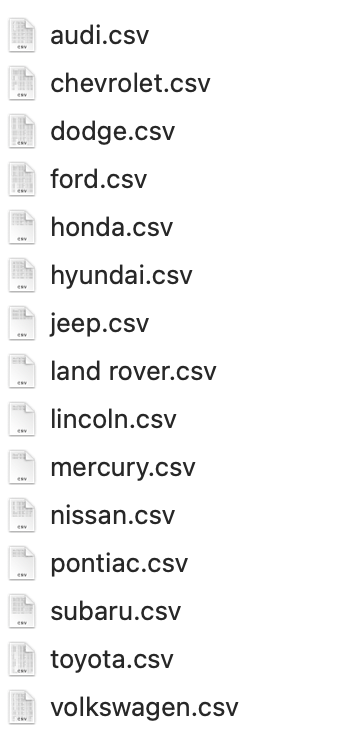
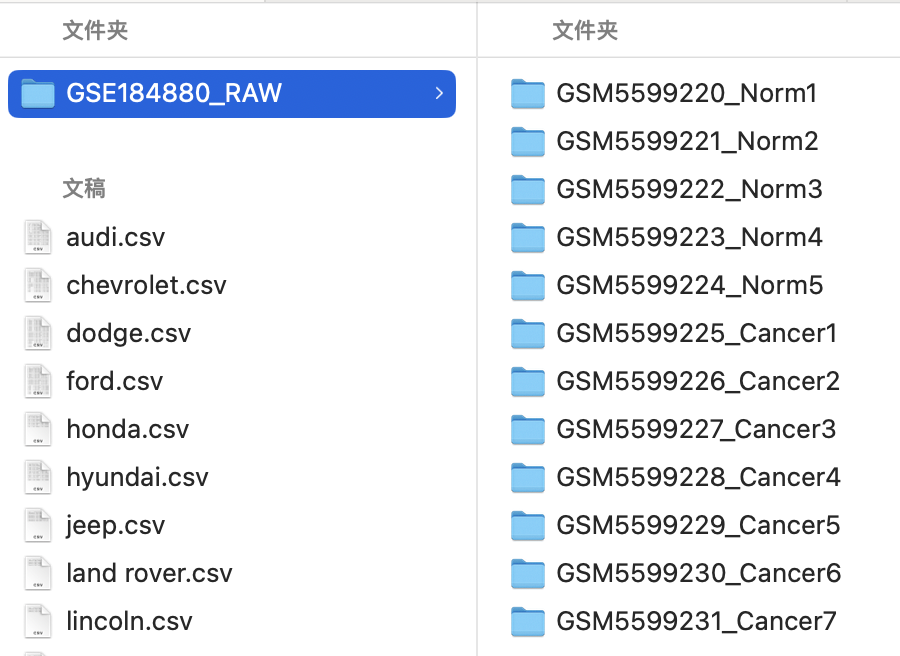
【例二】这个例子来自读取非标准10X格式文件,要实现在”output/r_basic/GSE184880_RAW”中批量建立文件夹的目的。
首先是构建文件夹的目录和名字,这一部分的目的参照读取非标准10X格式文件。
# 列出
files <- list.files("data/sc_supplementary/GSE184880_RAW")
files[1:10]
[1] "GSM5599220_Norm1" "GSM5599220_Norm1.barcodes.tsv.gz"
[3] "GSM5599220_Norm1.genes.tsv.gz" "GSM5599220_Norm1.matrix.mtx.gz"
[5] "GSM5599221_Norm2" "GSM5599221_Norm2.barcodes.tsv.gz"
[7] "GSM5599221_Norm2.genes.tsv.gz" "GSM5599221_Norm2.matrix.mtx.gz"
[9] "GSM5599222_Norm3" "GSM5599222_Norm3.barcodes.tsv.gz"dirnames <- gsub(pattern = ".barcodes.tsv.gz|.genes.tsv.gz|.matrix.mtx.gz",
replacement = "",
x = files) %>%
unique() %>%
paste0("output/r_basic/GSE184880_RAW/", .)
dirnames [1] "output/r_basic/GSE184880_RAW/GSM5599220_Norm1"
[2] "output/r_basic/GSE184880_RAW/GSM5599221_Norm2"
[3] "output/r_basic/GSE184880_RAW/GSM5599222_Norm3"
[4] "output/r_basic/GSE184880_RAW/GSM5599223_Norm4"
[5] "output/r_basic/GSE184880_RAW/GSM5599224_Norm5"
[6] "output/r_basic/GSE184880_RAW/GSM5599225_Cancer1"
[7] "output/r_basic/GSE184880_RAW/GSM5599226_Cancer2"
[8] "output/r_basic/GSE184880_RAW/GSM5599227_Cancer3"
[9] "output/r_basic/GSE184880_RAW/GSM5599228_Cancer4"
[10] "output/r_basic/GSE184880_RAW/GSM5599229_Cancer5"
[11] "output/r_basic/GSE184880_RAW/GSM5599230_Cancer6"
[12] "output/r_basic/GSE184880_RAW/GSM5599231_Cancer7"# 在“output/r_basic”目标位置先建立一个“GSE184880_RAW”用于存放一会儿构建的文件夹
dir.create("output/r_basic/GSE184880_RAW")通过pwalk()根据文件夹的名称“dirnames”建立文件夹。⚠️注意pwalk()只能应用于列表对象,所以这里通过list()进行了转化:
更多关于purr包的应用,参考:【R语言】优雅的循环迭代:purrr包、https://purrr.tidyverse.org。
apply家族 vs. map家族函数
There are two primary differences between the base apply family and the purrr map family: purrr functions are named more consistently, and more fully explore the space of input and output variants.
purrr functions consistently use . as prefix to avoid inadvertently matching arguments of the purrr function, instead of the function that you’re trying to call. Base functions use a variety of techniques including upper case (e.g. lapply(X, FUN, ...)) or require anonymous functions (e.g. Map()).
All map functions are type stable: you can predict the type of the output using little information about the inputs. In contrast, the base functions sapply() and mapply() automatically simplify making the return value hard to predict.
The map functions all start with the data, followed by the function, then any additional constant argument. Most base apply functions also follow this pattern, but mapply() starts with the function, and Map() has no way to supply additional constant arguments.
purrr functions provide all combinations of input and output variants, and include variants specifically for the common two argument case.
apply家族和map家族函数对照表:
| Output | Input | Base R | purrr |
|---|---|---|---|
| List | 1 vector | lapply() |
map() |
| List | 2 vectors |
mapply(), Map()
|
map2() |
| List | >2 vectors |
mapply(), Map()
|
pmap() |
| Atomic vector of desired type | 1 vector | vapply() |
|
| Atomic vector of desired type | 2 vectors |
mapply(), Map(), then is.*() to check type |
|
| Atomic vector of desired type | >2 vectors |
mapply(), Map(), then is.*() to check type |
|
| Side effect only | 1 vector | loops | walk() |
| Side effect only | 2 vectors | loops | walk2() |
| Side effect only | >2 vectors | loops | pwalk() |
Data frame (rbindoutputs) |
1 vector |
lapply() then rbind()
|
map_dfr() |
Data frame (rbindoutputs) |
2 vectors |
mapply()/Map() thenrbind()
|
map2_dfr() |
Data frame (rbindoutputs) |
>2 vectors |
mapply()/Map() thenrbind()
|
pmap_dfr() |
Data frame (cbindoutputs) |
1 vector |
lapply() then cbind()
|
map_dfc() |
Data frame (cbindoutputs) |
2 vectors |
mapply()/Map() thencbind()
|
map2_dfc() |
Data frame (cbindoutputs) |
>2 vectors |
mapply()/Map() thencbind()
|
pmap_dfc() |
| Any | Vector and its names |
l/s/vapply(X, function(x) f(x, names(x))) ormapply/Map(f, x, names(x))
|
imap(), imap_*() (lgl, dbl, dfr, and etc. just like formap(), map2(), and pmap()) |
| Any | Selected elements of the vector | l/s/vapply(X[index], FUN, ...) |
map_if(), map_at()
|
| List | Recursively apply to list within list | rapply() |
map_depth() |
| List | List only | lapply() |
lmap(), lmap_at(),lmap_if()
|
Since a common use case for map functions is list extracting components, purrr provides a handful of shortcut functions for various uses of [[.
| Input | base R | purrr |
|---|---|---|
| Extract by name | lapply(x, `[[`, "a") |
map(x, "a") |
| Extract by position | lapply(x, `[[`, 3) |
map(x, 3) |
| Extract deeply | lapply(x, \(y) y[[1]][["x"]][[3]]) |
map(x, list(1, "x", 3)) |
| Extract with default value | lapply(x, function(y) tryCatch(y[[3]], error = function(e) NA)) |
map(x, 3, .default = NA) |
assign()函数assign函数能够将某个值赋值给指定名称,从而实现循环中将每次运行的结果保存到一个对象中,而不覆盖上一次运行的结果。
x:变量名称/赋值对象/最后的新变量的名称
value:需要赋给x的值
下面的案例实现输出”A”, “B”, “C”, “D”四个变量,每个变量就是一次循环的结果:
append函数append()函数被广泛应用于将新的向量添加到现有的向量、列表或数据框中。
[1] 1 2 3 4 5 6 7 8#等价于
v3 <- c(v1, v2)list1 <- list(a = 1, b = 2, c = 3)
list2 <- list(d = 4, e = 5, f = 6)
list3 <- append(list1, list2)
list3$a
[1] 1
$b
[1] 2
$c
[1] 3
$d
[1] 4
$e
[1] 5
$f
[1] 6实际应用场景:在批量读取构建Seurat对象时,通过append()函数将每次的Seurat对象添加到列表中,最终得到一个包含了所有样本的单细胞数据的列表:
for (file in file_list) {
  # 拼接文件路径
  data.path <- paste0("data/other_single_cell_content/GSE234933_MGH_HNSCC_gex_raw_counts/", file)
  # 读取RDS文件数据
  seurat_data <- readRDS(data.path)
  # 创建Seurat对象,并指定项目名称为文件名(去除后缀)
  sample_name <- file_path_sans_ext(file)
  seurat_obj <- CreateSeuratObject(counts = seurat_data,
                                   project = sample_name,
                                   min.features = 200,
                                   min.cells = 3)
  # 将Seurat对象添加到列表中
  seurat_list <- append(seurat_list, seurat_obj)
}